On August 19, 2024, The Workplace Gender Equality Agency (WGEA) marked Equal Pay Day in Australia.
Marking the 50 days into the new financial year that Australian women must work to earn the same, on average, as men did last year, WGEA reiterated that for every $1 a man makes in Australia, women earn just 88 cents. The difference adds up to $12,376 a year on average. According to the WGEA, that differential “doesn’t add up or align with the Australian values of equality and a ‘fair go’ for all”. This is despite Australia having had equal pay laws in place since 1969 that stipulate that employers must pay their workers the same amount for doing the same job.
WGEA research has identified three main contributors to Australia’s gender pay gap:
- gender discrimination (36%)
- care, family responsibilities and workforce participation (33%),
- gender segregation by job type and industry (24%)
How is the gender pay gap calculated?
The gender pay gap can be calculated based on the average remuneration, or the median, or “middle”, of a list of remuneration values. Both versions are calculated the same way: (Average/median remuneration of men – Average/median remuneration of women) x 100 Average/median remuneration of men
Should I use the median or the average?
The average gender pay gap is a good measure to consider if you’re interested in remuneration of the group, as a whole. As the average is skewed by exceptionally high or low remuneration, i.e. outlier values, it will show if earnings are particularly concentrated for one gender. For example, it will show if there are more men in higher paying positions. Measuring gender pay gaps by median, i.e. the middle number in the range, allows you to understand the remuneration experience of the typical employee at a workplace.
How does my gender pay gap compare?
WGEA publishes the median gender pay gaps for employers with 100 or more employees on the Data Explorer1. Some employers write Employer Statements to give context to their gender pay gap results. Employers with a positive gender pay gap pay the ‘average/median man’ more than the ‘average/median woman’. Employers with negative gender pay gaps pay the ‘average/median woman’ more than the ‘average/median man’.
Conduct your gender pay gap analysis
To find out what’s driving your gender pay gap.
1. Choose a snapshot date Choose a specific ‘snapshot date’ for which you will pull your workforce data. Many workplaces have highs and lows throughout the year, so your snapshot date should be a date which most represents your typical workforce for that year. Ideally, for consistency, your snapshot date is the same one as the one you use if you report to WGEA.
2. Collect the data Collect employee demographic data, information on the jobs they do, and what they are paid. This information is generally available from your payroll or Human Resources Information System (HRIS). For private sector employers with 100 or more employees, much of this information is submitted annually to WGEA in the Workforce Profile and Workforce Management Statistics spreadsheets. You can use the data in these spreadsheets for your gender pay gap analysis2.
Table 1 outlines the data you need for these core analysis of key drivers of your gender pay gap.
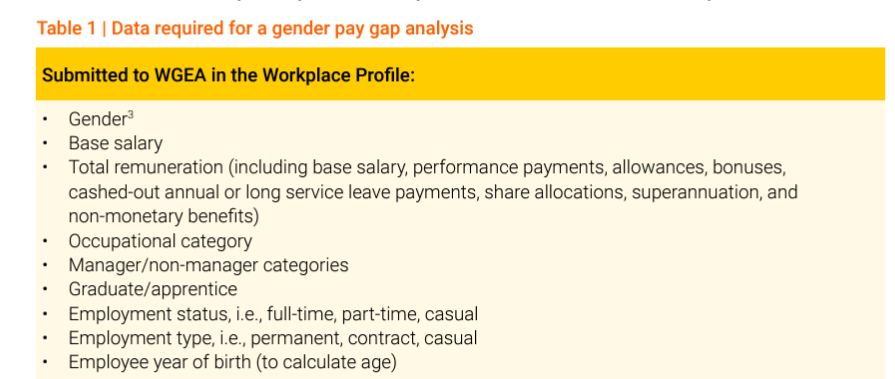
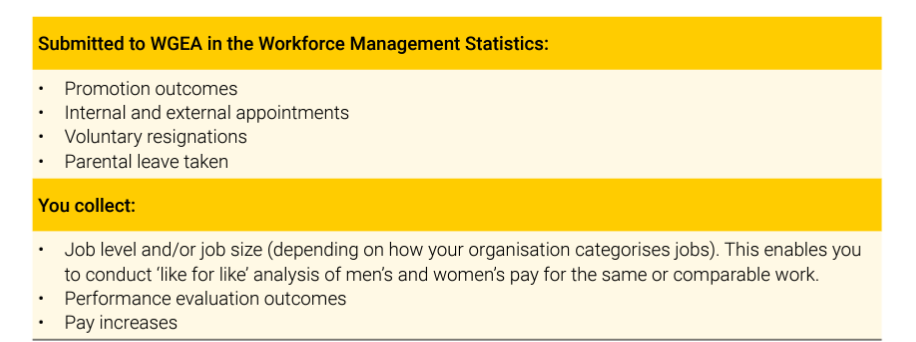
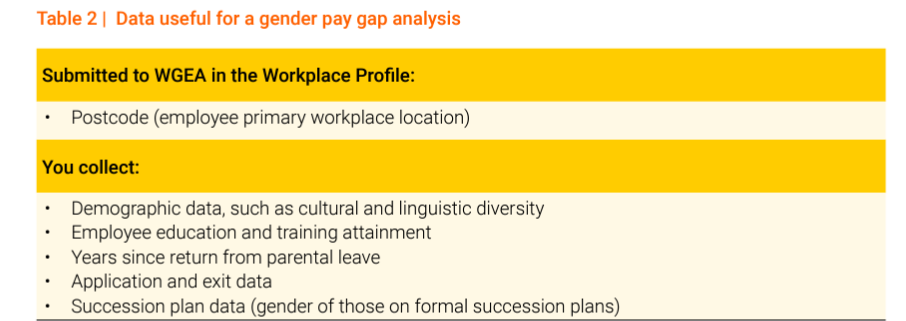
Table 2 lists additional data that you may find useful if you want to do a more detailed analysis.
Source: https://www.wgea.gov.au/take-action/gender-pay-gap/employer-gender-pay-gap-analysis-guide